Attack Map: Adding Nginx Logs
Table of Contents
Building upon the attack map: SSH article, this post will cover how to get process and use NGINX logs.
Intro
The beginning is a tangent as to how I decided to ingest NGINX logs
As a data engineer, I wanted metrics to show the amount of brute-force SSH requests I get in a day. I could get the data from Redis but it required N (number of SSH attempts) searches which didn’t make sense in my head. I knew that some 8 lines of SQL could do the job. I could also see what username was attempted the most in 5 more lines of SQL.
However, college Edwin is a dummy. He used a no-SQL database
NOOOOO he fell for the meme!!

I wanted to sync the data in the Redis database with the SSH attempts to a SQL database. However, the information stored in Redis was sparse, the log files contained more information so I against it. I would send the new logs to Postgres, this took 30 lines of python code:
import redis
import psycopg2

move_data_2_postgres():
  total_hackers = r.zcard("hackers")
  logger.info(f"Total hackers: {total_hackers}")
  for i in range(0,total_hackers, 10000):
      logger.info(f"Processing hackers {i} to {i + 10000}")
      pipeline = r.pipeline()
      for hacker in r.zrange("hackers", i, i + 10000):
          pipeline.get(hacker)
      results = pipeline.execute()
      hackers = [json.loads(result) for result in results]
      for hacker in hackers:
          hacker["time"] = pd.to_datetime(hacker["time"], unit="s")
      hackers = pd.DataFrame(hackers)
      logger.info(f"Read {hackers.shape[0]} rows from hackers table")
      num_rows = hackers.to_sql(
          "ssh_failed",
          engine,
          if_exists="append",
          index=False,
          chunksize=10000,
          method="multi",
      )
Nginx Logs
The main purpose of monitoring NGINX logs was to see malicious traffic and see how many visitors I get!
This process could be broken down into 3 main steps:
- Find the NGINX logs
- Process them into PostgreSQL
- Visualize the data
Where the hell are the NGINX logs?
These logs are stored at /var/log/nginx/access.log. Let’s get a stream of the IP’s coming in:
tail -Fn0 /var/log/nginx/access.log | grep --line-buffered -o '[0-9]\{1,3\}\.[0-9]\{1,3\}\.[0-9]\{1,3\}\.[0-9]\{1,3\}'
Let use Rsyslog to send NGINX logs directly to PostgreSQL as Rsyslog has a Postgres module but not a Redis one.
In hindsight, this makes sense since using Redis to store logs is a horrible idea!
This took 20 lines of configuration. I also had to change the rotation schedule from daily to when the files reached 100MB, incase I wanted to process data older than 2 days.
On my server I did this:
sudo nvim /etc/logrotate.d/nginx
- daily
+ size 100M
Modified my nginx.conf:
log_format json_output '{"time_local": "$time_local", '
'"path": "$request_uri", '
'"ip": "$remote_addr", '
'"time": "$time_iso8601", '
'"user_agent": "$http_user_agent", '
'"user_id_got": "$uid_got", '
'"user_id_set": "$uid_set", '
'"remote_user": "$remote_user", '
'"request": "$request", '
'"status": "$status", '
'"body_bytes_sent": "$body_bytes_sent", '
'"request_time": "$request_time", '
'"http_referrer": "$http_referer" }';
server {
listen 80;
server_name <domain_name>;
location / {
proxy_pass http://0.0.0.0:0000;
access_log /var/log/nginx/mywebsite/access.log json_output;
}
}
Also my /etc/rsyslog.conf file.
# The imfile module will wait for new loglines in the given file
input(type="imfile"
      File="/var/log/nginx/json/access.log"
      Tag="nginx:")

template(name="pgsql-template" type="list" option.sql="on") {
  constant(value="INSERT INTO accesslog (log_line, created_at) values ('")
  property(name="msg")
  constant(value="','")
  property(name="timereported" dateformat="pgsql" date.inUTC="on")
  constant(value="')")
}


if( $syslogtag == 'nginx:')  then {
  action(type="ompgsql" server="localhost"
        user="L"
        pass="L"
        db="logs"
        template="pgsql-template"
        queue.type="linkedList")
}
We have a table fro NGINX access logs now!
After getting the logs into a SQL database I could find out metrics so easily since I am now a SQL wizard.
select id,
log_line ->> 'time_local',
log_line ->> 'path',
log_line ->> 'time',
log_line ->> 'ip',
log_line ->> 'request'

from accesslog
you can see the SSH and HTTP data from 2022-09 to 2023-01 on:
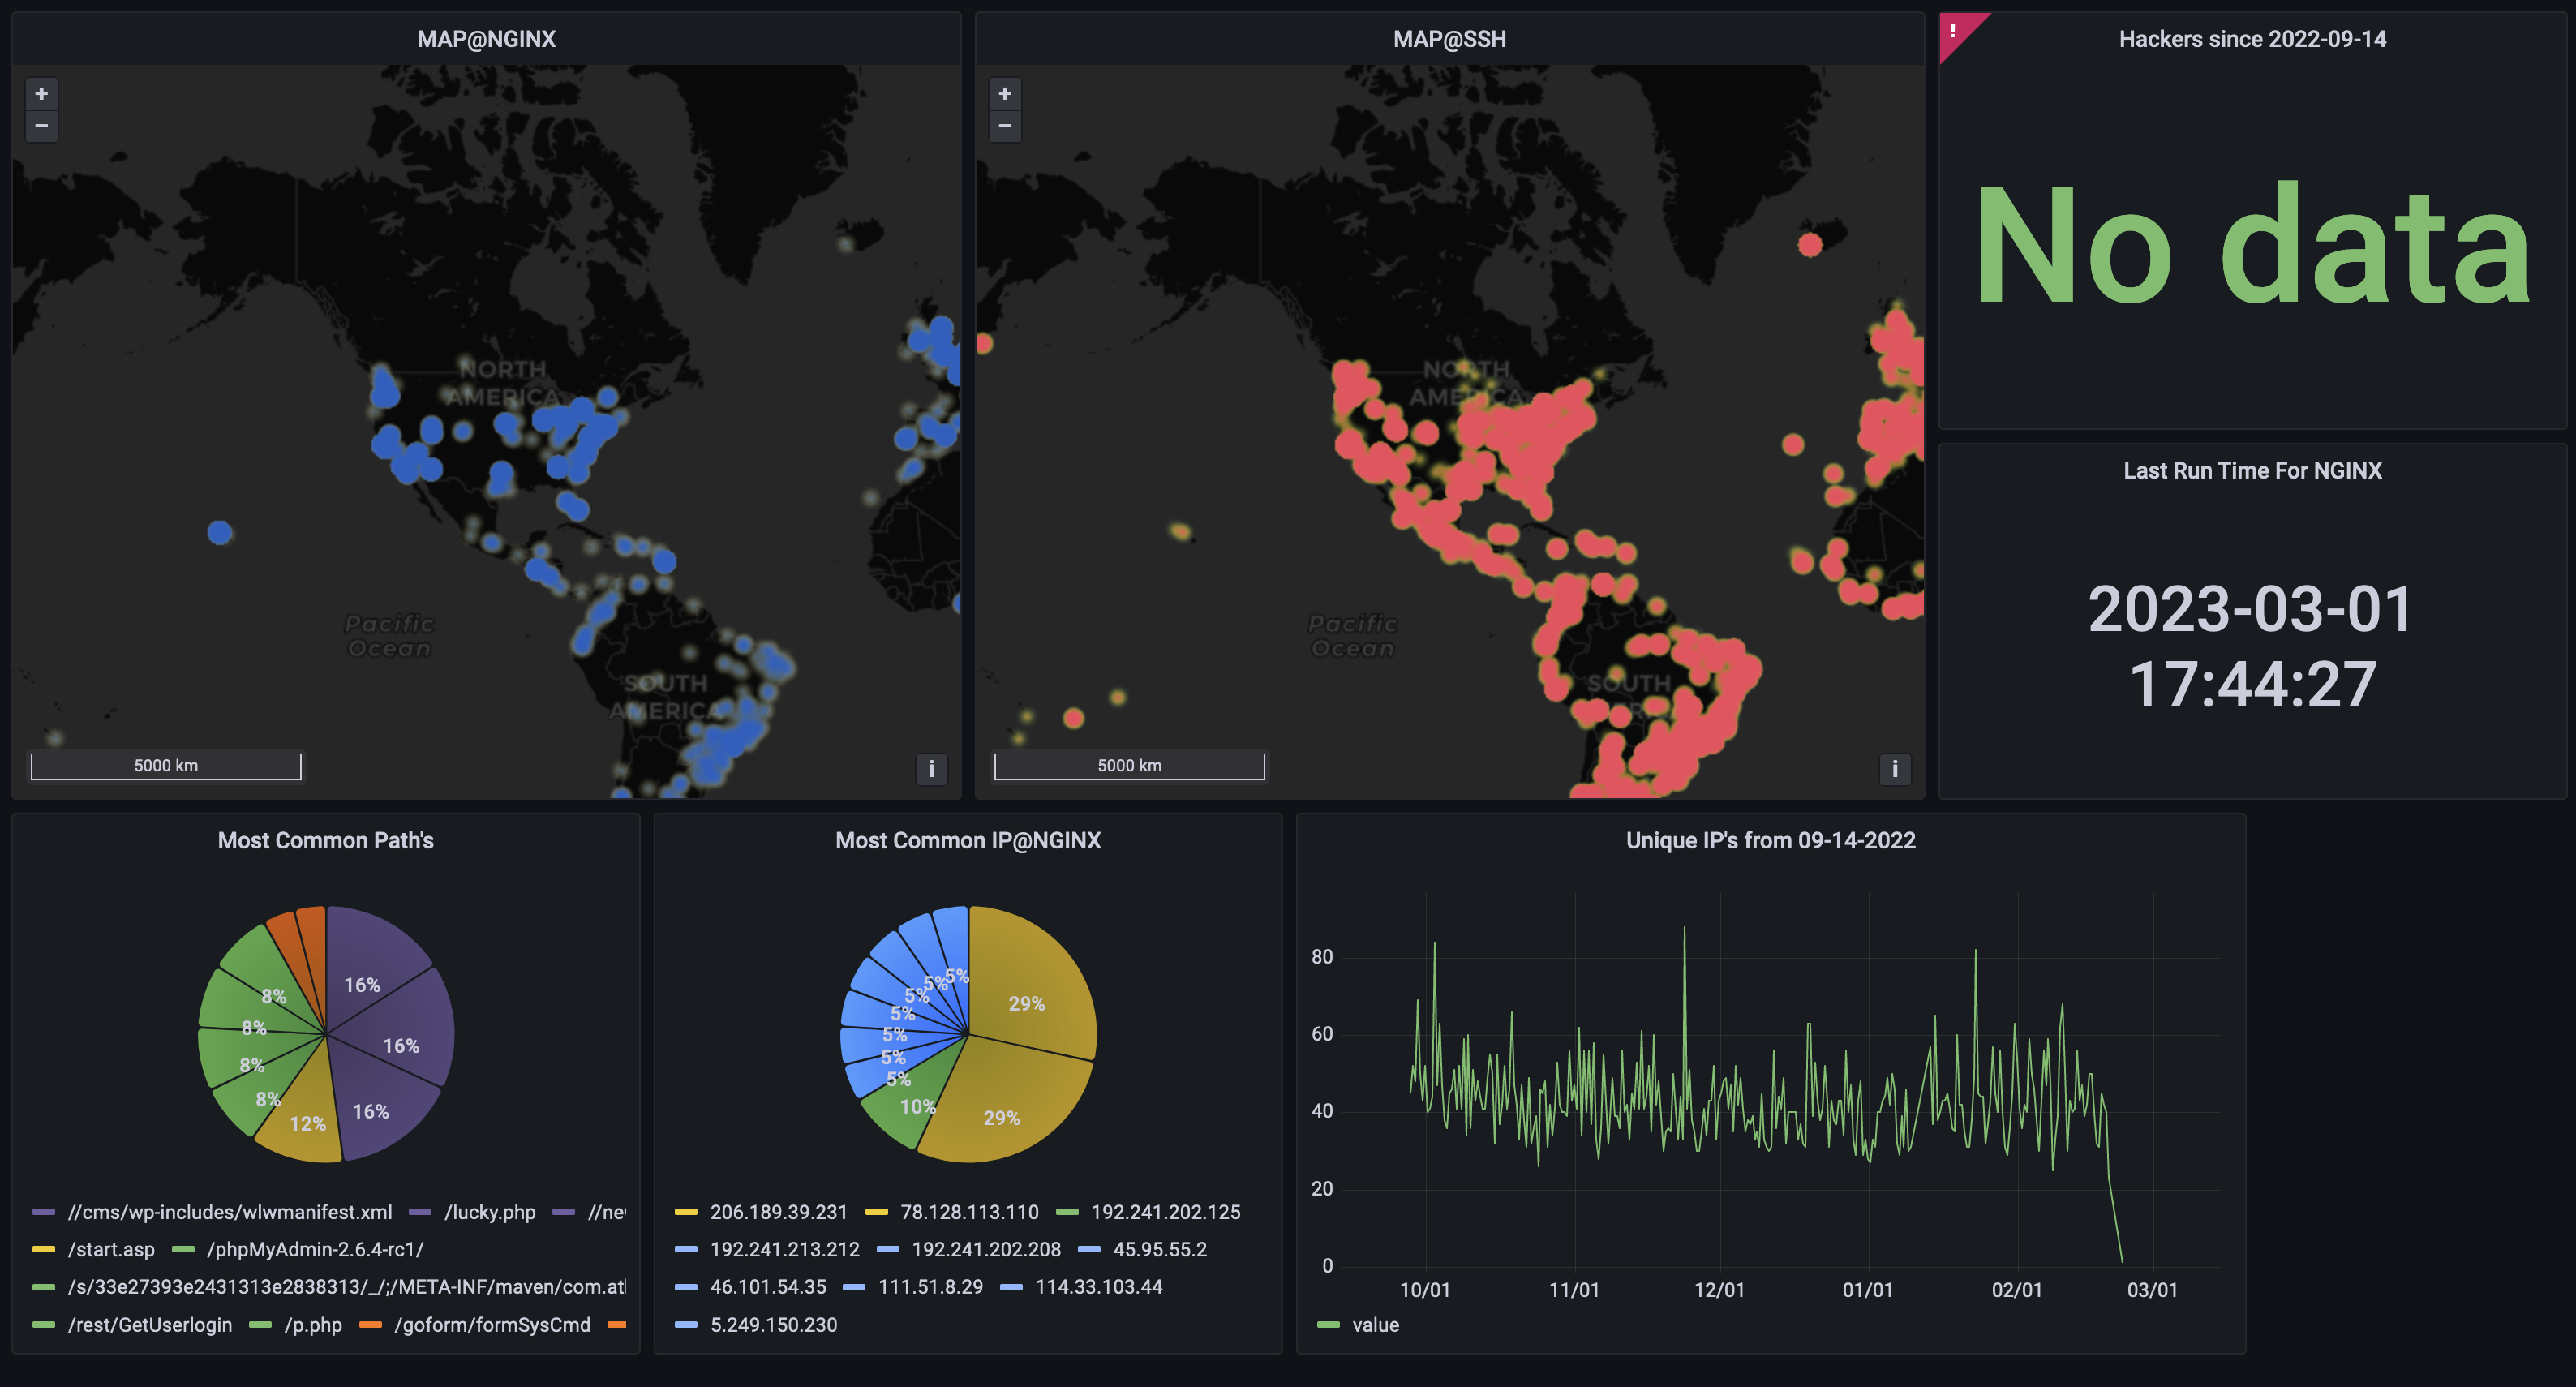
Wait why do I see a Grafana map and not that janky javascript map like before?
My raspberry pi’s SD card blew up (not in a literal sense, it stopped working!), I had to migrate to a new server, aka my gaming desktop and I decided to only run things on docker. I didn’t want to dockerize the attack map or change the javascript to accept this NGINX logs, so I switched to Grafana!
What I learned
- I created an application to ingest log data, enable easy queries and allow for visualization.
- I learned that storing data is not as straight forward as I thought. Well maybe it is now, ALWAYS use SQL unless you have a good reason not to!
- I ran into some roadbumps upgrading Ubuntu from 20.10 to 22.04, having SSL certs expiring and pointing to my old domain, to almost losing all my data due to config files being deleted by upgrading versions of Ubuntu.
Resources:
How to migrate from one postgres database to another:
How to sync 2 databases:
**ALTER SYSTEM SET wal_level = logical;**
CREATE SUBSCRIPTION logs CONNECTION 'dbname=logs host=host user=user password=pass' PUBLICATION logs;

- need the schema
pg_dump -h localhost -U postgres -Cs database | psql -h remotehost -U postgres database

test using SELECT * FROM accesslog

Redis migration was a bit easier:
REPLICAOF host 6379 -- disable auth first